I would love to be able to see a graph showing me the number of deployments per week for the last few months.
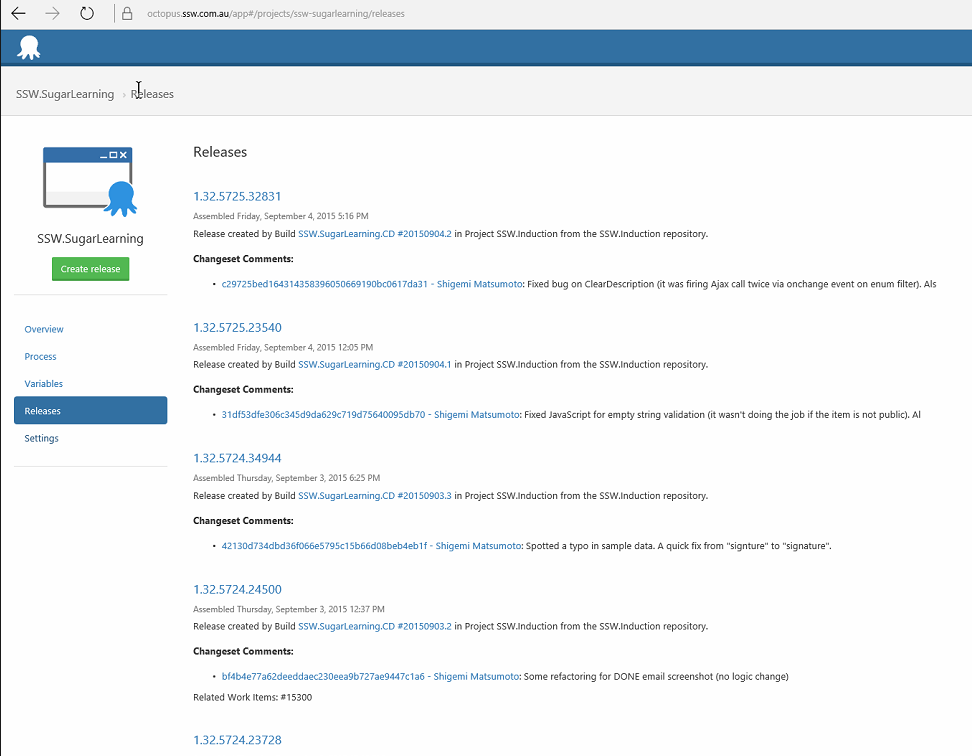
Figure: I’d love to quickly see the number of deployments per week (a graph would be ideal)

Do you agree that products always have room for improvement?
"Every day there are little things in software that we find annoying. Some write books about it, like Annoyances.org, but I thought this site would be more constructive.
BetterSoftwareSuggestions.com is proudly maintained by myself and the developers at SSW."
 - Adam Cogan
 I would love to be able to see a graph showing me the number of deployments per week for the last few months.
Figure: I’d love to quickly see the number of deployments per week (a graph would be ideal)