 -
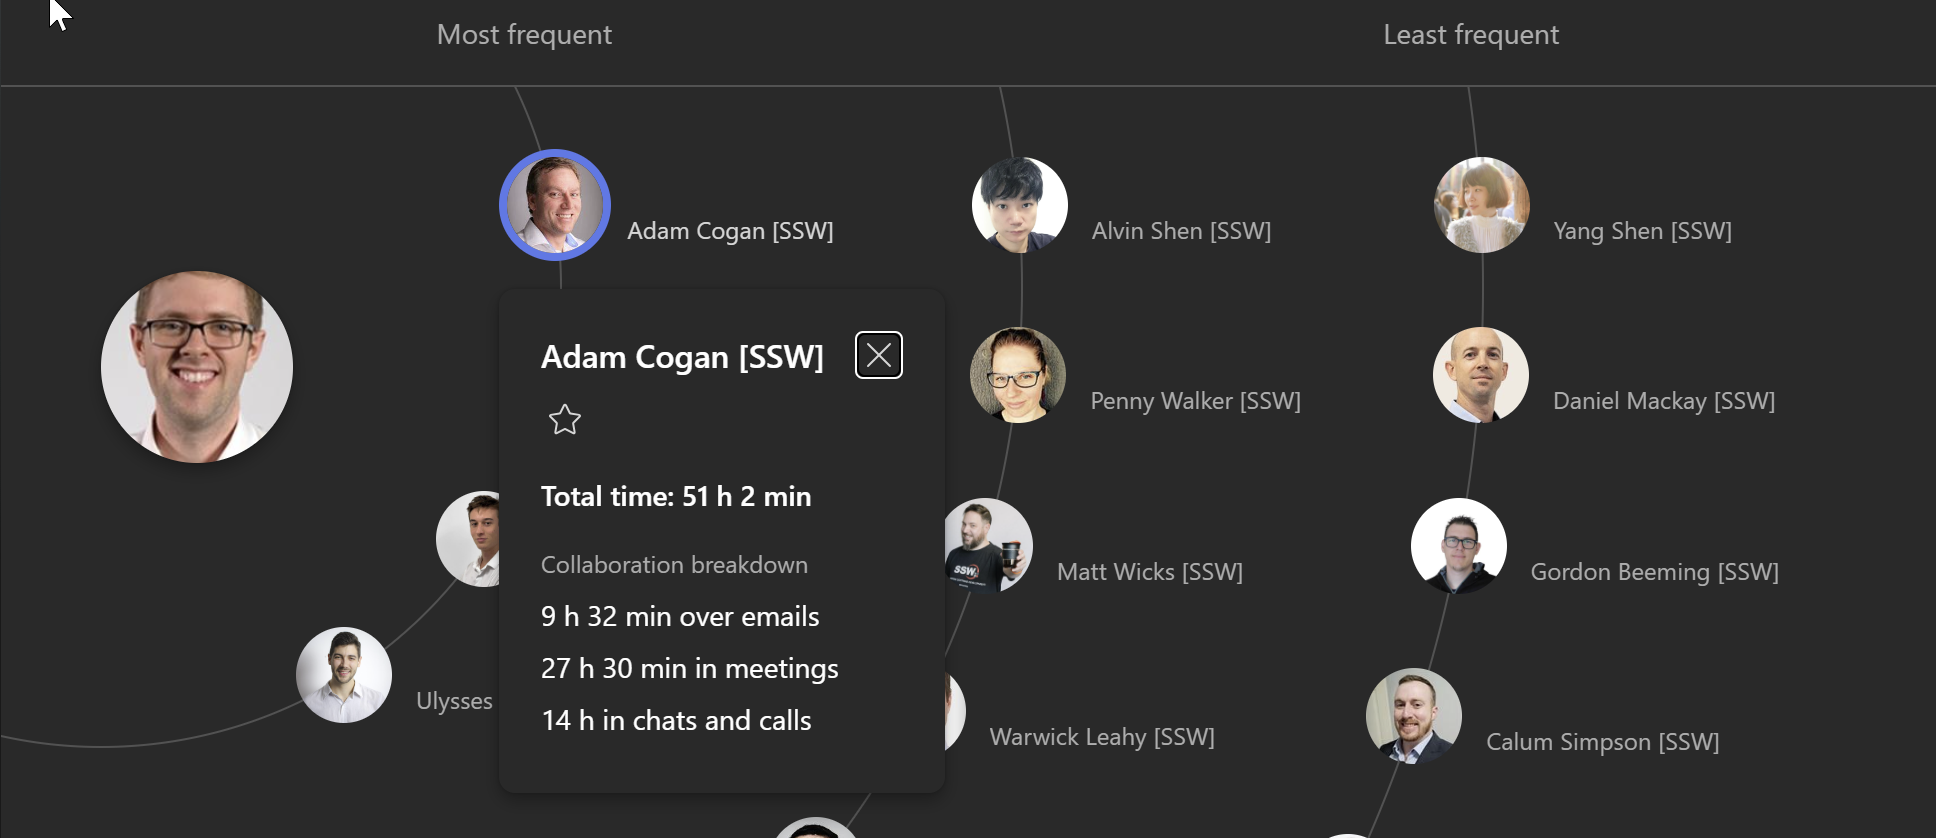
- When I look at Microsoft Viva Insights, I can see the people I communicate most with, but not whether it’s going up or down over time.
I want to see the trend so I know who I should spend some more time with.
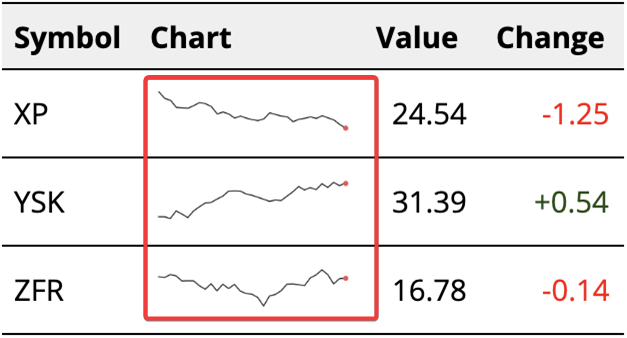
When you drill down into someone’s communication habits we should see 3 spark lines
- For email
- For meetings
- For calls and chats